Every Garmin health and sports stat explained
Deciphering your running watch in order to train and perform better
When it comes to tracking sports and health metrics, Garmin is one of the best in the business.
From basic fitness tracking to advanced health stats and running performance data, there's a bewildering amount of metrics on offer.
But some of these complex metrics can be hard to understand. And knowing what they mean can be a huge benefit to your training.
- Must read: The best Garmin watch for your needs
And because there are so many Garmin wearables covering multiple price points, it can be tough to work out which device has the features you need.
Understanding Garmin metrics will ensure you don't overspend on data you don't need. Essentially, this feature is designed to help you get your money's worth.
Activity and health stats
Steps
The number of steps taken. This number is estimated from the movement of your arm, much like traditional fitness trackers. Fitness tracking has become a staple across Garmin wearables.
Find it on: All current Garmin wearables
All day stress
Added to Garmin devices in 2017, this feature looks at heart rate variability to estimate the physiological stress your body is under.
This studies the gaps between heart rates to look at how your body is responding. A stress score is between 1 and 100 – and can be used as an indicator of whether it's the time to take a break, either from a work/life situation or a break in your training if you're putting your body under too much pressure.
Find it on: All current Garmin wearables
Sleep
Estimated via heart rate (if available) and arm movement, the quality of sleep is as important as the time spent in bed. Levels of deep and light sleep are reported in the Garmin Connect app.
Find it on: All current Garmin wearables
Resting Heart Rate
As well as tracking your active bpm during workouts, Garmin puts a focus on resting heart rate, which can work as a gauge of your improving fitness. Heart rate over the past four hours is shown on your device, with RHR over longer periods displayed in Garmin Connect.
Find it on: All current Garmin wearables
Calories
The calorific burn for your day is shown on your device. Non-heart-rate enabled devices will base this on your weight/height/age plus steps, but ones with optical HR will use this data for greater accuracy.
Find it on: All current Garmin wearables
Pulse Ox
Pulse Ox relates to blood oxygen and the measurement of oxygen levels or oxygen saturation in the blood.
That measurement is displayed in a percentage with a blood oxygen level of 95% or higher considered a good percentage to see.
If you see a percentage below 92%, it could be an indication of an undetected health issue. Garmin uses Pulse Ox to measure blood oxygen during sleep, continuously, and during high-altitude training.
Find it on: All current Garmin wearables
Sleep Score
Sleep score rates the quality of your sleep on a scale of 1-10. The higher the number the better quality of sleep attained.
That sleep score is generated from data including sleep duration, average stress score during sleep, sleep stages, awake time, and restlessness. On compatible watches, you can view sleep scores on the dedicated sleep widget.
Find it on: All current Garmin wearables
Respiration
Your respiration rate looks at how regularly you inhale and exhale in a minute. This can give you an insight into the increase in demand for oxygen to produce aerobic energy. A respiration rate of between 12-20 per minute is what you'd expect to see outside of exercise time. During exercise, a respiration rate could be anywhere from 40-50 over a minute. You can view your respiration rate in the Health Stats section of the Connect app.
Find it on: All current Garmin wearables
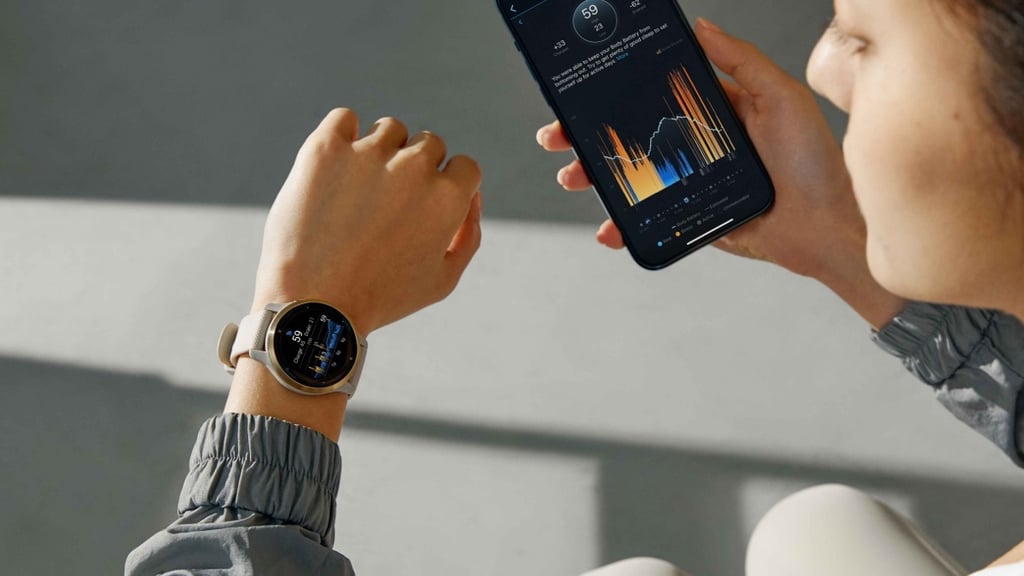
Body Battery
Understand how much energy you have to tackle your day by paying attention to your Body Battery metric. Garmin takes into account stress level (measured using heart rate variability), recent physical activity logged, and how much sleep you’ve been getting.
It then generates this metric as a percentage to represent your battery level. The higher the percentage, the better you're equipped to take on a tough workout. You can find your Body Battery metric under Health Stats in the Garmin Connect app.
Read our full guide to Body Battery.
Find it on: All current Garmin wearables
Fitness Age
This metric tells you how to fit you are compared to your actual age and can offer insight into whether you're making good health and lifestyle choices.
It's taken from information such as VO2 Max, and can also look to metrics like body fat percentage and body mass index if you pair your Garmin device with Garmin's smart scales.
You can view your fitness age in the Garmin Connect app by looking for your Health Stats in the dropdown menu.
Find it on: All current Garmin wearables
Intensity Minutes
Recommended guidelines state that 150 minutes of moderate exercise a week is the key to a healthy life. Luckily anything above a brisk walk counts and your Garmin will track this from step and heart rate data, if available.
Find it on: All current Garmin wearables
Running stats
Pace, Distance, Time
The staple data for any runner, many beginners will find these are all they need. Data is split down to give a little more detail, offering pace across each split (usually mile or kilometer) and enabling you to examine performance over long distances.
Find it on: All Garmin Forerunner, Vivoactive/Venu, Fenix, Epix, Instinct
VO2 Max estimate
An estimate of the maximum volume of oxygen your body can process at peak exercise via heart rate, this number is a universal measure of fitness. Watch this number rise to check your training is working. If it doesn't, then rethink your regime.
Find it on: Forerunner 55, 255, 745, 955, Fenix, Epix, Vivoactive 4/Venu, Instinct
Recovery Advisor
Getting the right amount of rest is essential to avoid injury and maintain performance. Recovery Advisor guides you on how long you should rest up based on your heart rate performance. Make sure the setting is turned on in My Stats on your device, then go for a run. You'll get a recovery check in the first few minutes of the run, and an advisory time when you save and complete your session. The minimum is six hours, the maximum is four days.
Find it on: Forerunner 55, 255, 745, 955, Fenix, Epix, Vivoactive 4/Venu, Instinct
Race Predictor
The Garmin race predictor will estimate finishing times of common race distances based on your VO2 Max. You'll need to pair an HR strap or use a device with optical HR, and ensure your profile information is up to date.
Find it on: Forerunner 55, 255, 745, 955, Fenix, Epix, Vivoactive 4/Venu, Instinct
Stress Score*
The Garmin Stress Score predicts how ready your body is for a workout session before you head out running. It's calculated from a three-minute standing test, rating your readiness for a session between 1 (very ready) and 100 (in a high-stress state). You will need an ANT+ chest strap to do the test. For all-day stress tracking, scroll down to our activity tracking section.
Find it on: All Garmin devices
Heart Rate Zones
Your heart rate can be banded into levels, reflecting the extent of your exertion. A well-rounded training plan will incorporate sessions at a range of levels, and you can ensure you're hitting heart rate targets using Garmin's zonal read-outs. On high-end devices, these levels will be auto-tweaked to your physiology.
Find it on: Forerunner 55, 255, 745, 955, Fenix, Epix, Vivoactive 4/Venu, Instinct
Lactate Threshold
Every runner has that level of exertion beyond which lies tiredness and pain – that's your lactate threshold. It usually strikes at upwards of 90% of your maximum HR. Run below threshold and you could have pushed harder, run above it and you will fade before the finish, so working out your level can be critical to race times.
Find it on: Forerunner 255, 745, 955, Fenix, Epix
Vertical Oscillation*
Vertical oscillation is the amount of bounce you have while running: less bounce means you're traveling more efficiently forwards, which makes for a faster, less tiring run.
Find it on: Forerunner 255, 745, 955, Fenix, Epix
Vertical Ratio*
Another running efficiency metric, your vertical ratio is your vertical oscillation to stride length displayed as a percentage. It gauges how much energy you're wasting not traveling forward, and a focus on this metric can improve speed and maximize energy.
Find it on: Forerunner 255, 745, 955, Fenix, Epix
Ground Contact Time and Balance*
Ground contact time is the amount of time in each step that you spend on the ground while running. Your Garmin will also measure the balance of your contact time, gauging whether you lean onto one foot or the other as you run. A green reading will show an even contact time, whereas amber or red status shows a lean onto one foot, which can cause efficiency problems as well as a heightened injury risk.
Find it on: Forerunner 255, 745, 955, Fenix, Epix
Stride Length*
Just as it sounds, this is a measure of the length of a runner's stride, which will have a high correlation to pace.
Find it on: Forerunner 255, 745, 955, Fenix, Epix
*Required external sensor such as Garmin chest strap or Running Dynamics Pod
Performance Condition
Much like Stress Score, Performance Condition is a mid-workout 'fuel gauge' that offers insight into whether to up your pace or slow things down as you run. It monitors heart rate variability to measure your body's fatigue, so if you're still full at the end of a session, you know what to do.
Find it on: Forerunner 255, 745, 955, Fenix, Epix
Cadence
Effectively your steps per minute, cadence is a measure of your running efficiency. Drop below 160spm and you're wasting energy without gaining speed – just look to the likes of Mo Farah who run at upwards of 200spm to see that more steps propel you much faster.
Find it on: Forerunner 55, 255, 745, 955, Fenix, Epix, Vivoactive 4/Venu, Instinct
Training Status/Load
This is effectively a metric that tells you where you sit with your current level of training. On your watch you'll find a dedicated screen that will let you know whether you're enjoying a productive period of training, peaking, maintaining your training level, or logging some unproductive training. This status is based on
Find it on: Forerunner 255, 745, 955, Fenix, Epix, Instinct
Training Effect
Along with Training Status, there's the ability to view Training Effect. Where Status is telling you about your current level of training, Status is telling you the impact of your logged workouts on your anaerobic and aerobic fitness. Compatible watches will look at user profile information, workout intensity, and duration, heart rate data, and workout history to generate that two-digit Training Effect number. If you see a 2.0 or above for aerobic training effect, that's a positive thing. See anything from 2.0 or above for anaerobic effect and it's the same story.
Find it on: Forerunner 255, 745, 955, Fenix, Epix, Instinct
Realtime Stamina
Some Garmin running watches can offer a live readout of your stamina, to help you max out your potential, without burning out. It works in two parts, offering an ever-diminishing score of stamina at your current effort level, and then a percentage of potential stamina, if you took your foot off the gas. Starting on 100% stamina relies on you being fully recovered from your last workout, so this will also be factored in.
Find it on: Forerunner 255, 955, Fenix, Epix
Training Readiness
Only available on elite Garmin wearables, this score is meshed data from sleep, heart rate variability levels, Training Load and Training status to give you a score out of 100 for your readiness to perform.
Find it on: Forerunner 955, Fenix, Epix
HRV Status
A pared-back version of Training Readiness does much the same as above but uses heart rate variability data to estimate your readiness to train. After creating an HRV baseline, it compares your 7-day rolling HRV and last night’s reading to your own personal average. Hit the red, and it’s time to take some rest.
Find it on: Forerunner 255, 955, Fenix, Epix
HRV Stress Test
A spot check of HRV levels, this metric has largely been replaced by the rolling Stress Score on newer devices. It can be used as a metric to check your current readiness for a workout session.
Find it on: Forerunner 255, 955, Fenix, Epix
Training Load Focus
On top of Training Load, Focus drills down into the type of workouts you’ve been focusing on. You can see whether you’ve been overworking anaerobic (purple), high aerobic (orange) or low aerobic training (blue), so you can keep your week balanced. Too much slow stuff, and get out for some tempo or sprints to keep your training balanced.
Find it on: Forerunner 255, 955, Fenix, Epix
Running Power
This metric looks at the output in terms of effort levels of running, and if used in real-time, can help you run more efficiently. Maintaining an even wattage, especially on hills or into the wind, can stop you from burning out. Read our guide to running power for more detailed information on how to use it.
Find it on: Forerunner 255, 955, Fenix, Epix
Cycling metrics
Speed, Distance, Time, Laps
On the basic cycling track, you can monitor your speed as well as the distance traveled from your Garmin device. There's also a laps feature, for those cycling on track or hitting regular routes.
Find it on: All Edge models, Forerunner 745, 955
Cadence
Essentially your RPM (revolutions per minute), and cadence is a huge metrics for indoor and outdoor cyclists alike, ensuring you're pedaling at the optimum rate.
Find it on: Garmin Edge, Forerunner 745, 955, Vivoactive, Fenix, Epix
Power/Total power in watts/Overall kilojoules (requires additional power meter)
The measure of the total power forced through your foot into the pedal. The more power you're pushing through the pedal, the faster you go. Le Tour riders obsess over it and once you know your power output you can train to improve it. In other words, it's the underlying stat for all your rides.
Find it on: Garmin Edge, Forerunner 745, 955, Vivoactive, Fenix, Epix
Training Stress Score (TSS) (requires additional power meter)
A measure of the stress placed on the body during a session, TSS will guide experienced riders on the balance between intensity and volume of workout sessions. Technically an estimate of the amount of glycogen burned by a ride, a score of fewer than 150 shows that no recovery is needed, while over 450 will require several days' rest.
Find it on: Garmin Edge, Forerunner 745, 955, Vivoactive, Fenix, Epix
Normalized Power (NP) (requires additional power meter)
When you're out on the roads it's naive to think you'll be pushing those pedals to the max at all times – not with pesky traffic, people, and roads to navigate. Normalized Power flattens out your ride, taking into account periods of coasting, and offering a better look at your exertion than a simple average of your power output across the ride.
Find it on: Garmin Edge, Forerunner 745, 955, Vivoactive, Fenix, Epix
Intensity Factor (IF) (requires additional power meter)
The ratio between your normalized power and your threshold power, a larger gap here shows greater intensity and can be a gauge on interval rides. It can also be used to reveal changes and improvements in your threshold power output.
Find it on: Garmin Edge, Forerunner 745, 955, Vivoactive, Fenix, Epix
Torque effectiveness (PS, dual-sensing Vector only)
This works out how much of the power being transferred to the pedal is working to propel the crank forwards, ensuring that there's no wasted energy as you're grinding those hills.
Find it on: Garmin Edge, Forerunner 745, 955, Vivoactive, Fenix, Epix
Pedal smoothness (PS, dual-sensing Vector only)
The pedal smoothness is a measure of how consistently power is applied through the rotation of the crank, helping you to ensure that it's applied evenly.
Find it on: Garmin Edge, Forerunner 745, 955, Vivoactive, Fenix, Epix
Swimming stats

Lengths, Distance, Pace
Garmin's basic swimming metrics will track the number of lengths you swim and the distance covered. Just begin the workout and everything will be tracked automatically.
Find it on: Garmin Swim 2, Forerunner 255, 745, 955, Fenix, Epix Vivoactive/Venu, Instinct
Stroke Count/Rate
Your stroke rate is a big marker of your swimming efficiency and this metric reports how quickly you pound the water per length or lap.
Find it on: Garmin Swim 2, Forerunner 255, 745, 955, Fenix, Epix Vivoactive/Venu, Instinct
Critical swim speed
This relatively new swim metric for Garmin watches is essentially your aerobic swimming threshold, telling you your (theoretical) fastest pace in the water. That critical speed is generated from 400-meter and 200-meter time trial tests, which you can complete on compatible Garmin watches.
Find it on: Garmin Swim 2, 745, 955, Fenix, Epix
Stroke type
Not only can your watch keep count of strokes, but it can identify the type of stroke as well. Garmin watches can detect the four competitive classes of swimming stroke: backstroke, breaststroke, butterfly, and freestyle.
Find it on: Garmin Swim 2, Forerunner 255, 745, 955, Fenix, Epix Vivoactive/Venu, Instinct
SWOLF
SWOLF is a unique metric to Garmin swimming devices, and as the name suggests is based on an amalgamation of swimming and golf. It works out your strokes per length, and whether that's above or below par, much like running cadence.
Find it on: Garmin Swim 2, Forerunner 255, 745, 955, Fenix, Epix Vivoactive/Venu, Instinct
Golf data
Putts Per Round, Greens, and Fairways Hit
By using the built-in scoring and shot-tracking on your Garmin Approach golf watch, you can calculate your averages by hole and round for the number of putts made, fairways hit, and greens in regulation.
Find it on: All Approach, Fenix, Vivoactive
SwingTempo
Getting a decent tempo to your swing is essential to high-quality, consistent ball striking and your Garmin watch can help. Not only will it measure the ratio of your backswing and downswing, but will also coach you using audible tones to help perfect your technique.
Find it on: Approach S60/S62
Swing Speed
Longer distances require a faster swing speed; luckily that can also be measured by your Garmin swing analyzer.
Find it on: TruSwing
Club Path
Hooks, slices, and other directional woes can normally be explained away by a screwy club path. Look for your club path angle to determine whether your swing path is 'in-out' (tendency to hook), or 'out-in' (tendency to slice), and work on bringing the angle to zero.
Find it on: TruSwing
Face to Target
Closing or opening the club face makes the ball go in the wrong direction. The Face to Target is displayed as an angle, and working to get this to 0 degrees will lead to straighter striking.
Find it on: TruSwing
Shaft Angle/Lean
Tracks the angle of the club shaft at impact, to check whether you're leaning too much forwards or backward, either of which can have a dramatic effect on ball striking.
Find it on: TruSwing