Fitbit Estimated Oxygen Variation: We explain SpO2, sleep apnea, and blood oxygen levels


We spoke to Fitbit scientist to find out how it all works
One of the most important metrics on a Fitbit tracker is the Estimated Oxygen Variation—and now that every tracker is fitted with an SpO2 sensor, everyone can take advantage.
Blood oxygen may be used to detect signs of sleep conditions such as sleep apnea, and offer a better analysis of what’s going on with our bodies in those hours.
But Fitbit’s Estimated Oxygen Variation data needs a little more explanation.
We spoke to Dr. Conor Heneghan, Fitbit’s Lead Sleep Research Scientist, to explain everything you need to know.
What is Estimated Oxygen Variation?
Estimated Oxygen Variation is an estimate of how much your blood oxygen levels fluctuate during sleep. This is done via the SpO2 sensor, which works by shining red and infrared light through your skin and measuring how much of it is absorbed by your blood.
Your Fitbit tracker will track blood oxygen saturation as a percentage, which you can see in your Health Metrics dashboard. But Estimated Oxygen Variation is different.
The Estimated Oxygen Variation metric examines the difference in the highs and lows of your blood oxygen levels.
It’s important to note that Estimated Oxygen Variation is a Fitbit Premium feature, so only subscribers will see it.
Fitbit devices with Estimated Oxygen Variation
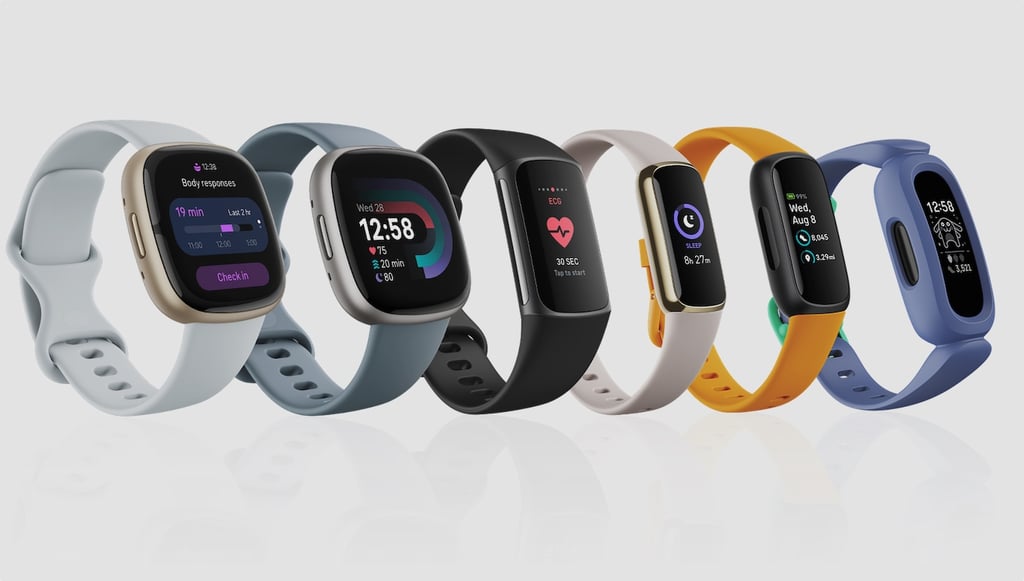
The feature can be found on any Fitbit tracker with an SpO2 sensor.
This includes:
- Fitbit Charge 6, 5, and 4
- All Fitbit Versa models
- Fitbit Sense and Sense 2
- Fitbit Charge 4/5/6
- Fitbit Luxe
- Fitbit Inspire 3
- Fitbit Air
Estimated Oxygen Variation Graph explained
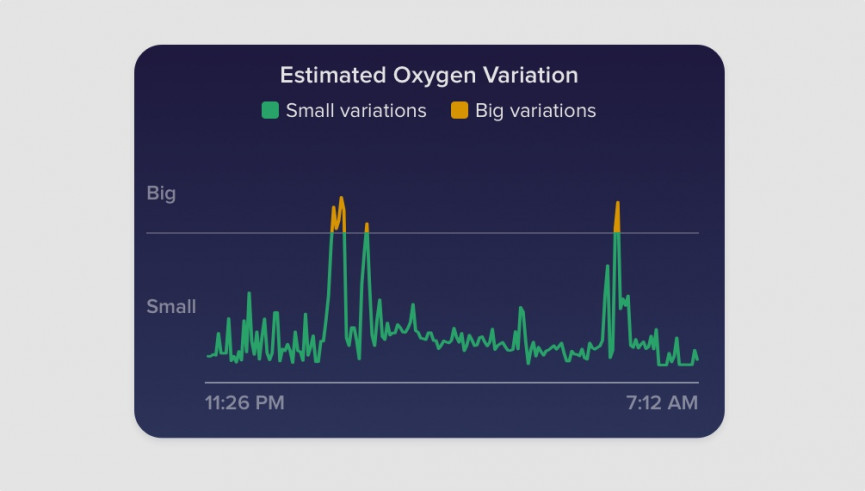
You’ll find Estimated Oxygen Variation in your sleep stats. Head to sleep stats, choose a night’s sleep, and go to the Restoration tab.
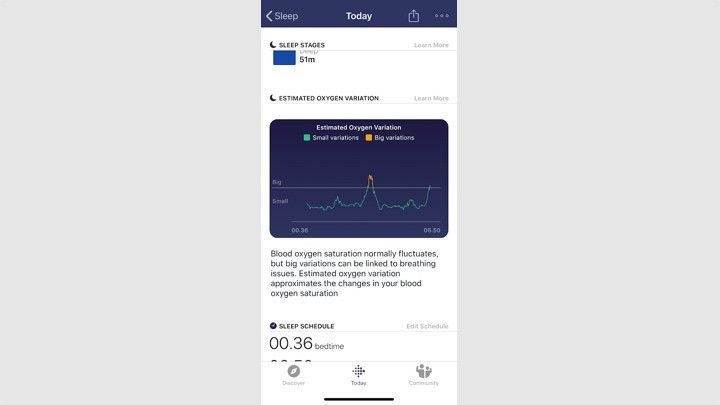
Some devices will give you a reading for your blood oxygen level. However, a Fitbit spokesperson told us that the graph provided by Fitbit is an “estimation of the variability of oxygen levels in the bloodstream”.
It’s not a graph of the actual SpO2 estimate.
The example screenshot above shows what the graph will look like—and from what we can see, blood oxygen is monitored by the sensor during sleep.
Essential reading: Fitbit’s Sleep Score explained
“We’re showing a metric that correlates with the average variability of your blood oxygen level,” said Dr. Conor Heneghan.
“Let’s say Person A has oxygen level of 96% +/-1% and Person B has oxygen level of 95% +/- 4% throughout the night, then Person B will see a higher “estimated oxygen variation” throughout the night. We calculate this every minute.”
Can Fitbit track sleep apnea?
“We are not claiming this can be used to correlate with sleep apnea status,” said Dr. Conor Heneghan. “No, there is not currently an alert within the device or app. This graph is another opportunity for us to provide more data to our users.”
So while a large level of variation in blood oxygen might show sleep apnea, Fitbit won’t spell this out for you. Though you should talk to a physician if you notice or feel something unusual.
“Seeing frequent big variations is a clue that you may be experiencing breathing disturbances during sleep—something you might want to talk to your doctor about, particularly if you experience symptoms such as excessive tiredness, loud snoring, or gasping during sleep. Keep in mind that how you wear your device can also affect this data.”
There are lots of caveats here, not least the “estimated” part of the Fitbit name. It’s likely the company got fed up waiting for FDA clearance in the wake of competitors getting similar features out onto the wrists of consumers. So, for now, you need to check the data and make your own conclusions.
What else can the Estimated Oxygen Variation Graph show?
Of course, blood oxygen isn’t all about sleep apnea.
“Sleep apnea is a common cause of variation in oxygen level, but sleeping at altitude can also increase variability. It’s probable that some types of heart failure are associated with variation in oxygen level, too (Cheyne-Stokes respiration),” said Dr. Conor Heneghan.
So while Fitbit isn’t claiming this to be a medical feature, if you’re seeing high instances of Estimate Oxygen Variation, you might want to show that data to your doctor, so they could assess it with proper, medical-grade devices.