We look at market share and shipments of the big players
The wearable tech market is still going from strength to strength – with growing shipments and sales across smartwatches, fitness trackers and more.
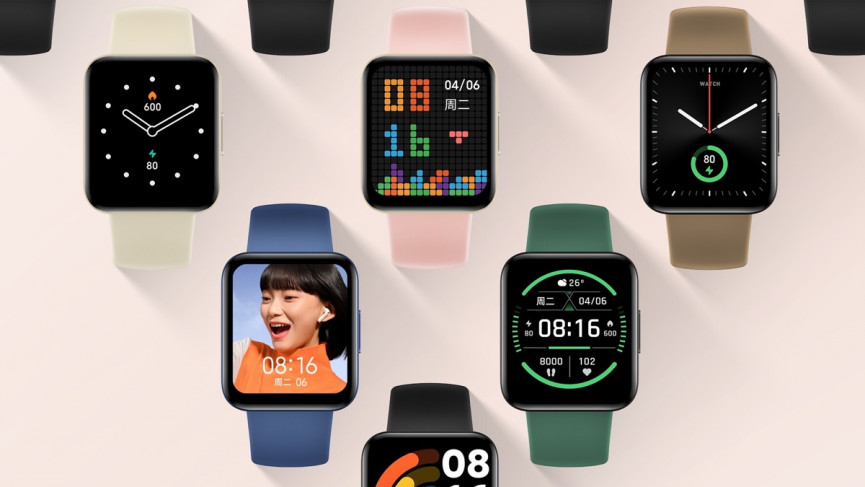
Smartwatches are still growing quickly with the likes of Apple and Samsung gaining big market share. But so are fitness trackers, which continue to defy prophesies of doom.
But wearables are changing. Smartwatches are becoming cheaper and more accessible – and long gone are the days where key complaints were a lack of features.
Below, we’ve assembled key stats, studies and analysis of the smartwatch and fitness tracker market – both in terms of shipments and market share, but also key surveys on how consumers feel about wearable devices.
How people use smartwatches
- Health and fitness still overwhelmingly popular use cases
- 2/3 buyers bought smartwatch in last 12 months
- 50% first time owners
- 6% of owners don’t intend to replace device
- 89% use smartwatch every day or most days
Most popular wearable tech use cases
- Casual fitness tracking – 61%
- Checking notifications – 59%
- Health and wellbeing monitoring – 57%
- Alarms and reminders – 52%
- Timer or Stopwatch – 40%
- Listening to or controlling music – 32%
- Using the voice assistant – 29%
- Payments – 25%
- Controlling smart home device – 20%
Health features checked every day
- 69% – Steps
- 62% – Calories burned
- 52% – Activity or sports data
Smartwatch improvements wish list
- 51% – longer battery life
- 22% – Improved health and fitness tracking
- 21% – better design
- 6% – More apps
Reasons to buy
- 56% – interested in features
- 24% – access to specific fitness features
- 24% – I needed a new watch
Reasons people have upgraded
- 41% – I wanted to change
- 36% – longer battery life
- 35% – latest health tracking features
Source: CCS Insight (August 2021)
Shipments year-on-year with future forecasts
- Smartwatches haven’t swallowed fitness trackers
- Both in both sectors
- Smartwatches are on track to double fitness tracker sales though.
| Fitness trackers | Smartwatches | Total | |
| 2016 | 52m | 37m | 89m |
| 2017 | 40m | 51m | 91m |
| 2018 | 44m | 74m | 118m |
| 2019 | 61m | 97m | 158m |
| 2020 | 78m | 115m | 193m |
| 2021* | 90m | 142m | 232m |
| 2022* | 101m | 173m | 273m |
*Projected | Source: CCS Insight (August 2021)
Buying smartwatches
Smartwatch retention
- Only 2% watch owners don’t use device anymore
- 90% use watch most/every day
- Consistent across all brands.
- 75% use sports or activity tracking every day (90% Fitbit)
Smartwatch satisfaction
- 59% highly satisfied with features used
- 37% somewhat satisfied
- 45% satisfied with battery life – one of the lowest (most requested improvement)
Replacing smartwatches
Most users expect to replace smartwatches within two years – just like smartphones
- 66% – within 2 years
- 27% – In more than 2 years
- 7% – I don’t think I will replace it ever
Non-smartwatch owners:
Reasons for not buying a smartwatch
- 49% – too expensive
- 37% – wait until they’re cheaper
- 16% – wait until they become better
Source: CCS Insight | Topic: Webinar: Smartwatch End-User Survey of 4,000 US and UK (Feb 2020)
Top 5 wearable companies market share
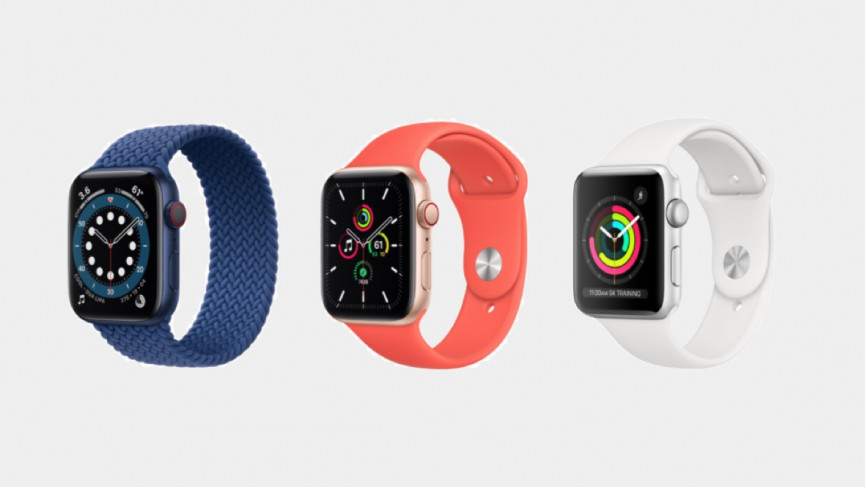
- Apple market share is down YoY
- Shipments up 9.3% though
- Indian boAT wearables storm into top 5 globally.
- Big majority of wearable sales still cost under $200
| Shipments | Q2 2021 share | Change | |
| Apple | 32.2m | 28.2% | +9.2% YoY |
| Xiaomi | 14.0m | 12.3% | +37.8% |
| Huawei | 11.7m | 10.2% | +38.5% |
| Samsung | 9.7m | 8.5% | +37.4% |
| Image Marketing (boAT) | 4.6m | 4.1% | +478% YoY |
| Others | 41.9m | 36.7% | +38.2% YoY |
Source: IDC (August 25 2021)
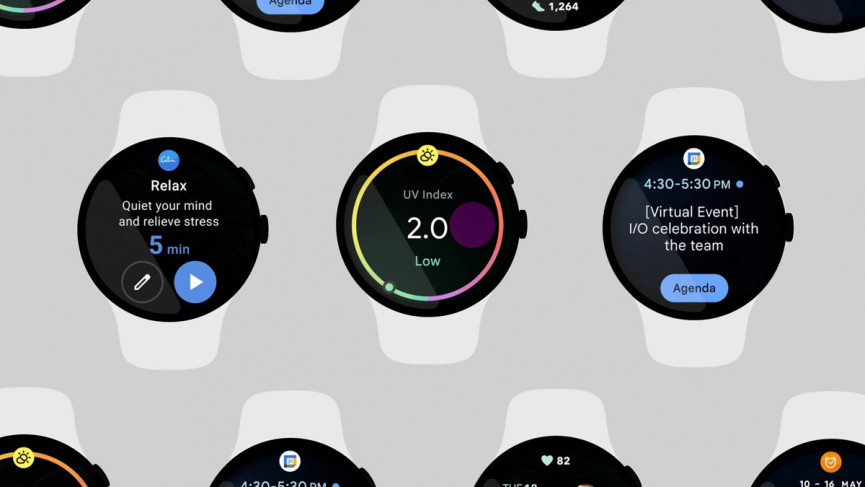
Smartwatch OS market share 2021
| 2018 | 2019 | 2020 | 2021 | |
| watchOS | 26.4% | 26.3% | 30.3% | 33.5% |
| Tizen | 5.5% | 9.3% | 8.5% | 8.0% |
| Huawei | – | – | 7% | 6.7% |
| Amazfit | – | – | 5.8% | 4.2% |
| Wear OS | 2.9% | 3.2% | 4.4% | 3.9% |
| Fitbit | 2.8% | 4.2% | 2.7% | 3.7% |
Source: Counterpoint Research (May 2021)
Indian wearables market share – Q2 2021
- 1. Nexxbase (Noise) 28.6% 25.5% 538.4%
- 2. Imagine Marketing (BoAt) 26.9% – –
- 3. Huami (Amazfit) 9.3% 25.1% 110.9%
- 4. Fire-Boltt 5.5% – –
- 5. Realme 4.7% 21.3% 24.7%
Source: IDC (Aug 2021)
AR, VR and mixed reality market share
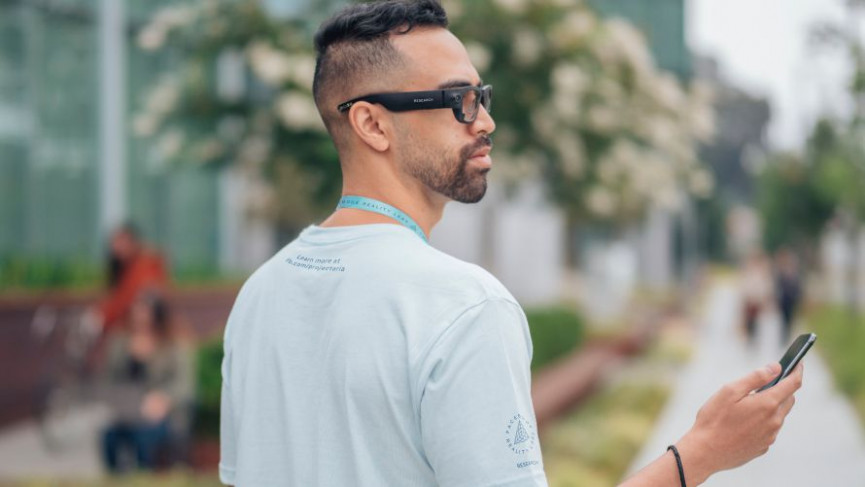
- 2021: $30.7 billion
- 2022: $58.7 billion
- 2023: $124.4 billion
- 2024: $296.9 billion


